Power analysis software
We deliberately decided against any operating elements and visualization on our power analyzer series LK601. Instead we developed measurement acquisition software that goes beyond the functionalities of a classic power meter. Whether range or trigger settings. Everything is guaranteed to be quickly accessible in POWERStudio. Easy, quick saving and loading. Various applications and test cycles are quick and easy to launch!
All measurement data are available straight on the computer. No time consuming data transfer via USB stick or third-party software. If our extensive analysis tools are not sufficient, the data can simply be exported into a common format.
Measurement applications are very individual. Our system adapts to your requirements. Not the other way around! Create your own live calculations (from all available data) and display them in the way you need it. Suit up your E-Drive-Systems!
Toolbar
The header located toolbar is always accessible and enables quick changes to all relevant channel and trigger settings.
Navigation
The navigation takes place as you would expect from modern apps. The structure is clear, simple and clearly arranged. All settings are max. 2 click away. Break with endless submenus and hidden settings.
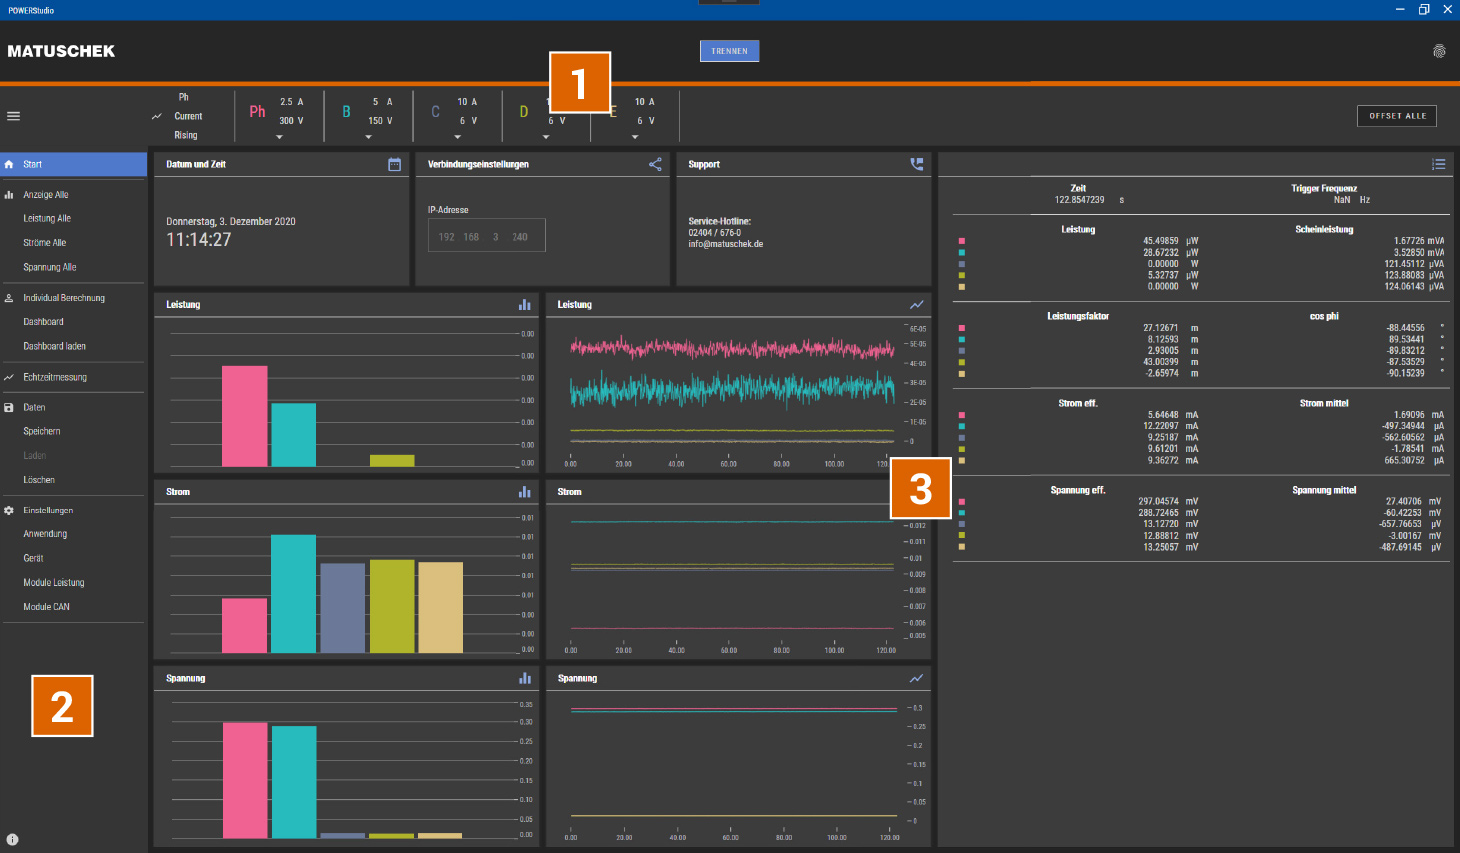
Custom Views
Designed for flexible and customizable adaptation right from the start. Create measurement overviews according to your needs and maintain a clear overview.
Having demanding testing applications and requirements, it is not enough to simply record the electrical measured parameters. In case a machine's efficiency needs to be calculated, mechanical and electrical measured values have to be correlated. With our DAQ-Software you have the possibility to create your own calculation rules right from the beginning. You can combine all available data with one another. Whether electrical, CAN- or other data.
sin(), min(), max(), ....if, else, >, <, = , ....
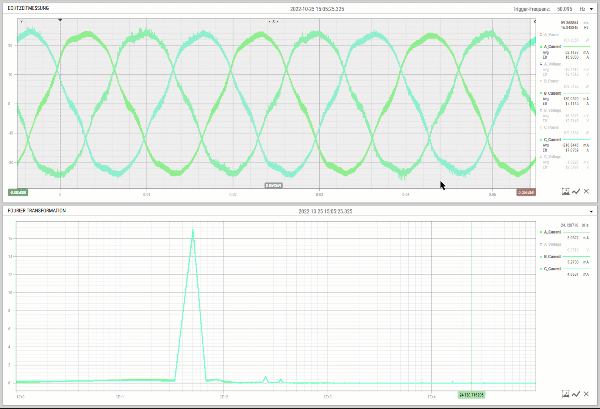
Just because we didn't want to build another oscilloscope doesn't mean you have to give up real-time measurement and harmonic analysis. Record current and voltage of all phases in parallel and in real time. With a maximum sampling rate of 10 MSa/s, you can analyze even high-frequency signals with high accuracy.
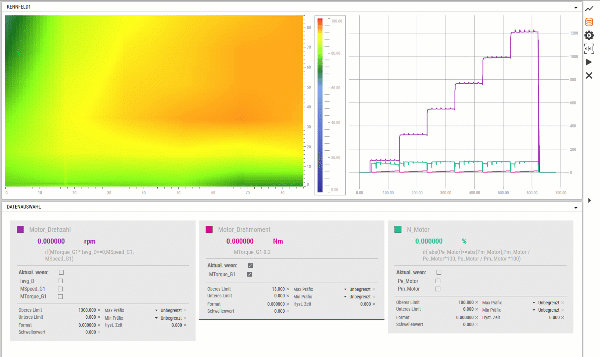
Efficiency maps provide information about the performance of electrical drive components such as machines or drive inverters. The efficiency of the device under test (DUT) is recorded at various operating points. With respect to drive applications these approached operating points are usually speed and torque. The result is represented by 3D heatmaps whereas the third dimension is the color of the plotted values.
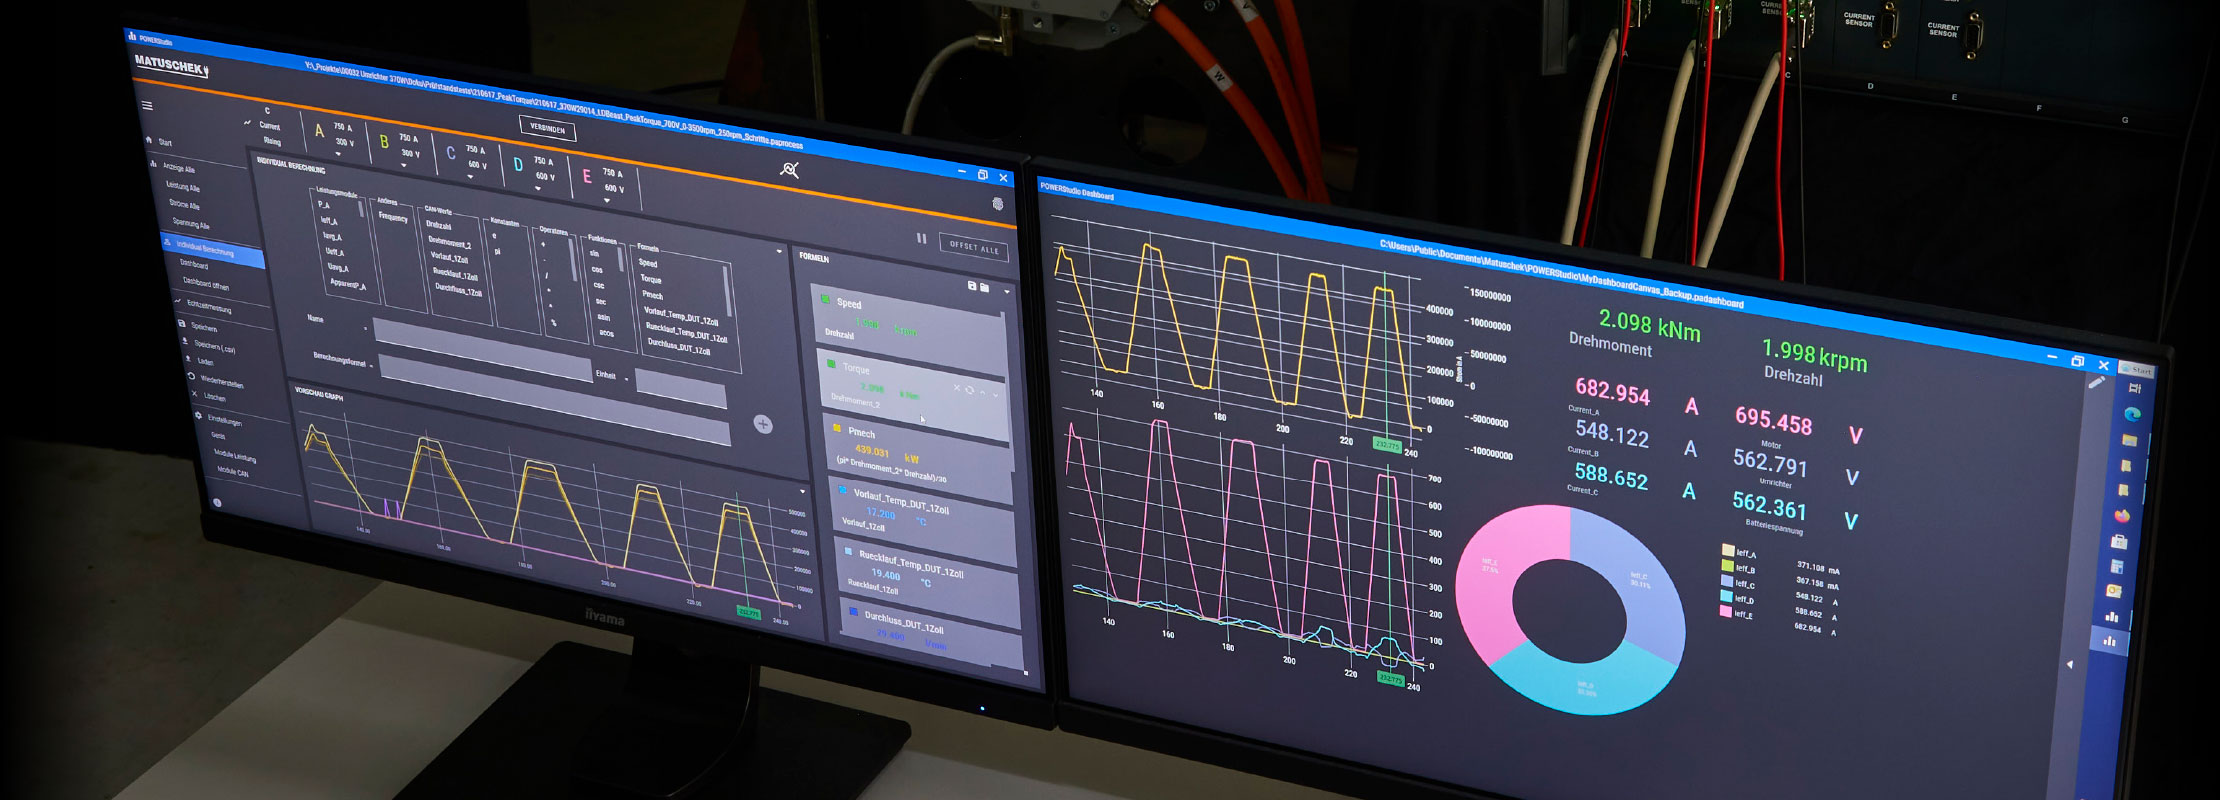
Whether in research & development or EOL testing. Every test application is different. We offer the opportunity to create your own dashboard views. The custom views can also be applied to a multi-screen system. Measurement values can be linked to each visual UI-element individually. No matter whether electrical values (P, U, I), CAN-data or user-defined calculation values. Fast, intuitive and simple!
The documentation of your measurements can also be presented exactly the way you need it — with minimal effort. Whether directly in POWERStudio or as a CSV or Excel export, you decide how your results are displayed. Using your own Excel report template offers extensive options for organizing measurement data in a clear and well-structured format. By defining data point triggers, the recording of relevant data can be carried out almost automatically and with full reproducibility.

In classic measurement applications, the acquired data is recorded and then exported manually . These are then manipulated and analyzed using third-party software. Alternatively, measuring devices are also integrated into LabView environments. Either cases involve an enormous amount of time and / or money.
With our POWERStudio software we offer extensive analysis possibilities, which are linked with each other across windows and graphs. Of course, all those tools can also be used in conjunction with our customized user views. On- and offline! Load old measurement data and do your data analysis within your self-created visual environment.

Cursor
You quickly find the precise values and measurement times using the linked data cursor. The cursor is linked to one another across both, graphs and windows.

Averaging
Defining a time window for averaging is quick and easy. All measured values within that window are averaged. Yes, again across graphs and windows.

Zoom
Measurement charts can be enlarged intuitively. The graphs time axes are scaled parallel to one another. No more manually arranged curves.
| Required | Recommended | |
|---|---|---|
| CPU | Intel® - or AMD-Processor 64-Bit; 2 GHz or higher | |
| Operating System | Windows 10 (64 Bit) Version 1809 or higher; LTSC-versions are not supported | |
| RAM | 8 GB | 32 GB |
| Video Card | Onboard | DirectX-compatible GPU with min. 2GB VRAM |
| Hard Disk | 2 GB of HDD memory | 2 GB of SDD memory |
| Monitor | 1 LCD | 2 or more |
| Screen resolution | 1920 x 1080p | 2560 x 1440p |

Electromobility
rethought.
Matuschek Meßtechnik GmbH
Werner-Heisenberg-Str. 14
52477 Alsdorf
Germany